Review of Last Week's Trading Plan
Last week, we did not have any trading plan, as in my personal opinion,
limiting trading at this point is essential to avoid losses. I believe the
only thing we should be doing right now is “waiting” and “preserving
capital.”
To explain this view, I’ll provide a few reasons:
First, you can observe the chart showing the total trading volume across
CEX exchanges over the past 3 months.
Trading Volume on Exchanges in 2025 - Source: The Block (05/04/2025)
You can see that the trading volume has been gradually decreasing since
January. In particular, in March, the trading volume almost reached a
temporary bottom and there was no significant volatility.
=> When there is no large trading volume, price fluctuations cannot
occur, which means we cannot make profits through price differentials by
trading effectively.
Next, this is a period where financial markets are heavily influenced by
news. On April 3rd, President Donald Trump announced retaliatory tariffs,
causing almost every financial market, including the crypto market, to
experience strong volatility.
=> The current unstable economic and political context is causing
technical analysis in trading to be more influenced, making it less accurate
as a basis for forming a trading plan.
Analysis and Outlook for Bitcoin (BTC) Next Week
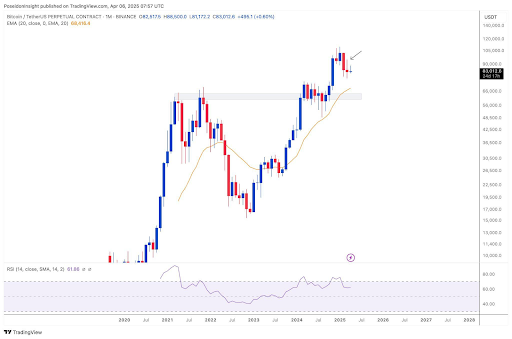
First, let's analyze a bit about how the previous month's candlestick
closed. The candlestick for the previous month is still a red candle, but
there are a few details you should pay attention to:
The body of the candlestick is very small, indicating that the price
movement throughout March was not too significant. Although the candlestick
has relatively long upper and lower shadows, the closing price was close to
the opening price => This shows that both buyers and sellers were
relatively balanced, and the market did not experience significant
volatility.
The lower shadow pierced through the lower shadow of the previous month's
candlestick (February), but quickly retracted => The selling pressure
tried to push the price lower to continue the trend from February, but
failed.
=> We can conclude: The market is still sideways with very low volume.
After the sharp drop from February, it seemed that the bears had the upper
hand, but the bulls were strong enough to prevent the price from falling
further. The support zone around $78,000 is still a strong support level,
and the price reaction at this level will be crucial in determining whether
BTC will rise or fall in the near future.
In the weekly chart (W), we can see that BTC is respecting two key support
and resistance zones:
Support: After a false breakout around $78,000, the price
has risen back to the $89,000 level. As mentioned above, $78,000 will
continue to act as a strong support for BTC until it is broken.
Resistance: The 20-week EMA is acting as a dynamic
resistance for BTC. For the last 3 weekly candlesticks, the price has been
unable to break above this moving average. The slope of the 20-week EMA is
downward, suggesting that the price may continue to trade sideways just
below the EMA (20) or even decline sharply from here.
=> The market will likely continue to trade sideways between the price
range created by these two support and resistance zones until one of them is
broken.
Based on the analysis in the larger timeframes, we can create a trading
plan for BTC as follows: Wait for the price to drop to around the $78,000 -
$78,300 range and buy, with a stop-loss below $76,500 and a take-profit
target at $84,000.
BTC.D
After several days of sideways movement at the key 61.5% level, BTC.D
has bounced back. With this upward momentum, it is entirely possible for
BTC.D to return to the 64% range and then continue to rise in the medium
term. Therefore, we will continue to limit purchasing altcoins during this
period.
Some plans for altcoins
ETH
ETH will be the token I use as a main indicator for timing when to return
to altcoins. Personally, I believe that in the medium term, ETH will
return to the $1200 - $1300 range once again. This will be the level where
ETH might create a temporary bottom, and I will buy ETH/altcoins if the
price hits this range.
HMSTR
For those who follow the buy/long strategy, HMSTR could be
a token to watch. In the 4-hour timeframe, after several fluctuations
around an important price level, there has been a breakout candle
confirming a break.
You can enter around 0.00233x, with a 5% stop-loss and a 10% - 15%
take-profit.
Macro News
Next week, there will be some important news on Thursday (April 10th) at
7:30 PM, with two significant updates:
-
Consumer Price Index (CPI): This data will assess
inflation in the U.S. economy. If the actual CPI is higher than
expected, it will be seen as positive for the USD and vice
versa.
-
Unemployment Claims: If the actual claims are
higher than expected, it will be seen as negative for the USD, and
vice versa.
Countinue Reading »